Analyse
Biodiversity KPI Calculations – Observation & Relationship Indices
Learn how Gaia calculates biodiversity KPIs from observation and relationship data — including Shannon, Simpson, and Berger-Parker indices — and generates AI-assisted ecological reports.
Gaia provides built-in Key Performance Indicator (KPI) calculations for biodiversity data. KPIs offer objective, data-driven measurements of biodiversity drawn from two distinct data sources: observations and relationships.
KPI Types
Observation KPIs
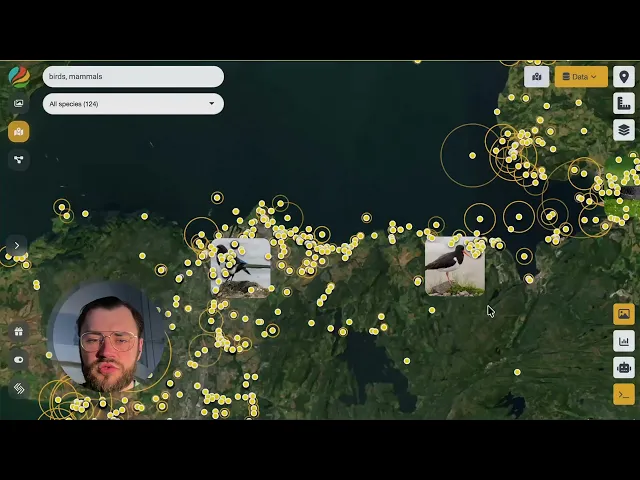
Observation KPIs are derived from species occurrence points plotted on the map. They summarise biodiversity within a mapped area using the following metrics:
Species count — total number of distinct species recorded.
Observation count — total number of individual sightings.
Shannon biodiversity index — measures species diversity by accounting for both richness and evenness.
Simpson dominance index — quantifies the probability that two randomly selected individuals belong to the same species.
Berger-Parker dominance index — expresses the proportional abundance of the most common species.
Threat category summary — breaks down observations by IUCN (or equivalent) threat status, linking data directly to conservation relevance.
Relationship KPIs
Relationship KPIs are available in the Nexus module and analyse ecological connections (links) between taxa rather than individual occurrence points. These KPIs provide taxonomic breakdowns of connections at multiple levels: class, order, family, genus, and species. Where observation KPIs answer "what is present?", relationship KPIs answer "how are taxa connected?".
Biodiversity KPIs per Area
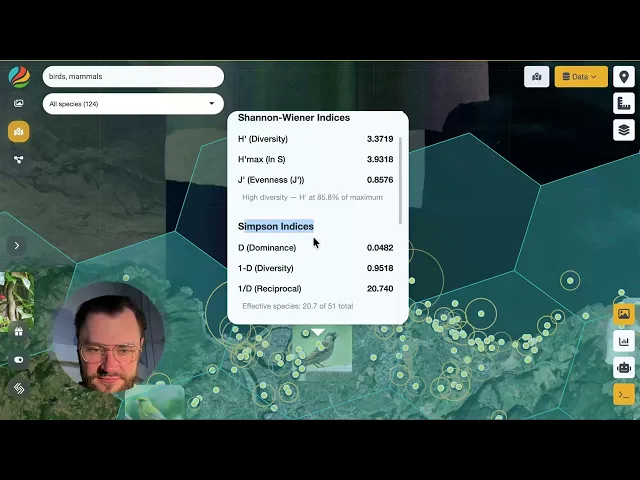
Visualise biodiversity indices for birds and mammals using H3 hexagonal grids. Explore species diversity, dominance, and conservation status across space and scale.
AI-Assisted Reporting
KPI results from either module can be sent to an integrated AI model (Claude) to generate detailed ecological reports. Generated reports typically cover:
Temporal patterns in the data.
Community structure and trophic-level analysis.
Conservation priorities based on threat status.
Critical assessment of data quality and potential biases.
The AI applies a self-critical approach, flagging limitations and uncertainties in the underlying data before drawing conclusions. This ensures that reports remain transparent and scientifically grounded.
Where to Find KPIs
Module | Data source | KPI focus |
|---|---|---|
Map | Observation points (dots) | Species richness, abundance, diversity indices, threat status |
Nexus | Taxonomic relationships (links) | Connection metrics, taxonomic-level breakdowns |
Intended Audience
These tools are designed for ecologists, conservation managers, biodiversity researchers, and data scientists who need to quantify biodiversity objectively and communicate findings through structured, reproducible reports.
Next Steps
Load a biodiversity dataset into Gaia.
Use the Map module to review observation KPIs for your area of interest.
Switch to the Nexus module to explore relationship KPIs.
Send your KPI results to the AI reporter to generate a comprehensive ecological summary.
Review the AI-generated report for flagged data-quality issues and tailor it to your research or management goals.
Join our Community Forum
Any other questions? Get in touch